Section Scoring
Sections represent the major functional areas of your HubSpot portal — General setup, Sales, Marketing, Automation, Service, and Reporting. Each section aggregates its block scores into a single section score, and these section scores combine into the final portal score.
This page explains how section scoring works, including the base weights and dynamic redistribution logic.
The Six Sections
Section titled “The Six Sections”Every audit organizes its findings into six sections:
| Section | Base Weight | What It Covers |
|---|---|---|
| General | 25% | Portal settings, user management, GDPR, integrations, naming conventions, data hygiene |
| Sales | 20% | Pipelines, deal stages, sequences, meeting links, quotes, forecasting setup |
| Marketing | 15% | Forms, CTAs, email configuration, landing pages, SEO, social settings |
| Automation | 15% | Workflows, enrollment criteria, branching logic, suppression, re-enrollment |
| Service | 10% | Tickets, knowledge base, feedback surveys, SLAs, support pipeline |
| Reporting | 15% | Dashboards, custom reports, attribution, analytics views, data quality |
These base weights reflect the relative importance of each area for a typical HubSpot portal. General carries the highest weight because it covers foundational configuration that affects everything else.
How Section Scores Are Calculated
Section titled “How Section Scores Are Calculated”Within each section, the section score is the weighted average of its block scores. Each block’s weight is determined by the aggregate importance of its data points.
Section Score = Sum(blockScore x blockWeight) / Sum(blockWeights)
Block weights are derived from the sum of the data point weights within that block. A block containing several P1 fundamental data points will carry more weight than a block with only P4 items.
Dynamic Weight Redistribution
Section titled “Dynamic Weight Redistribution”Not every audit covers every section equally. Some portals may not use Service Hub at all, resulting in very few data points in that section. When a section has less than 20% coverage — meaning fewer than 20% of its possible data points returned meaningful results — JetStack AI redistributes that section’s weight to the other sections.
How Redistribution Works
Section titled “How Redistribution Works”- JetStack AI calculates the coverage percentage for each section (data points with results / total possible data points).
- Any section below the 20% coverage threshold has its base weight removed from the scoring.
- The removed weight is redistributed proportionally across the remaining sections based on their original base weights.
Example
Section titled “Example”Suppose a portal does not use Service Hub, so the Service section has only 5% coverage:
| Section | Base Weight | Coverage | Adjusted Weight |
|---|---|---|---|
| General | 25% | 92% | 27.8% |
| Sales | 20% | 85% | 22.2% |
| Marketing | 15% | 78% | 16.7% |
| Automation | 15% | 70% | 16.7% |
| Service | 10% | 5% | 0% (redistributed) |
| Reporting | 15% | 65% | 16.7% |
The Service section’s 10% weight gets split proportionally among the five remaining sections. This prevents a portal from being penalized for not using a hub they do not need.
Why This Matters
Section titled “Why This Matters”Dynamic redistribution means your portal score accurately reflects the areas you actually use. A company that focuses heavily on Sales and Marketing will not receive a lower score simply because they have not set up Service Hub. The scoring system adapts to your actual portal usage.
However, if you do have a section activated with data in it, that section will count toward your score even if the findings are poor. Redistribution only kicks in when coverage is genuinely minimal.
Section Scores in Reports
Section titled “Section Scores in Reports”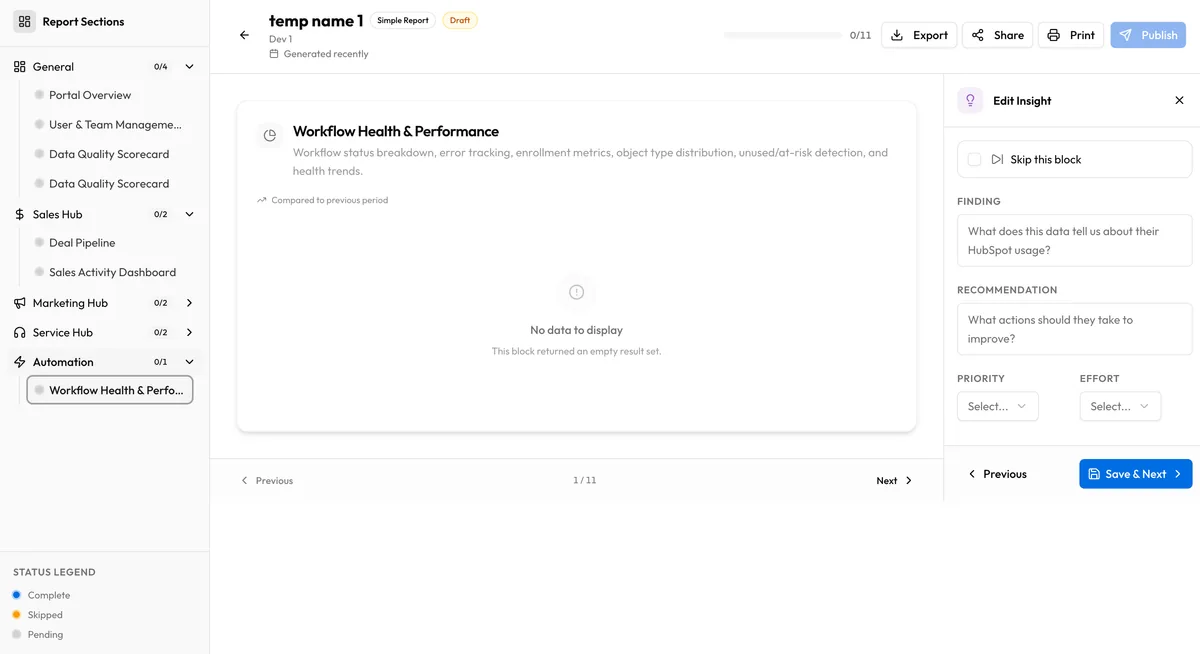
In audit reports, each section displays:
- The section score (0-100)
- The number of blocks evaluated
- The number of data points measured
- A breakdown of block scores within the section
This gives you a clear view of which functional areas are strong and which need attention. You can use the section-level view to prioritize improvement efforts — focus on the section with the lowest score and the highest weight for maximum impact.
Relationship to Portal Score
Section titled “Relationship to Portal Score”Section scores feed directly into the portal score calculation. The portal score is the weighted average of all section scores using the base weights (or adjusted weights after redistribution). See Portal Score for the complete formula.