Task Details
Every task in the Activity Log has a detail view that provides a full breakdown of what happened during the operation. Whether the task completed successfully, failed entirely, or finished with partial results, the detail view gives you the information you need to understand the outcome and take action.
Opening the Detail View
Section titled “Opening the Detail View”From the Activity Log, click View Detail on any task row. This opens the task detail page with the full breakdown.
You can also reach the detail view by clicking directly on the task row in the Activity Log table.
Detail View Layout
Section titled “Detail View Layout”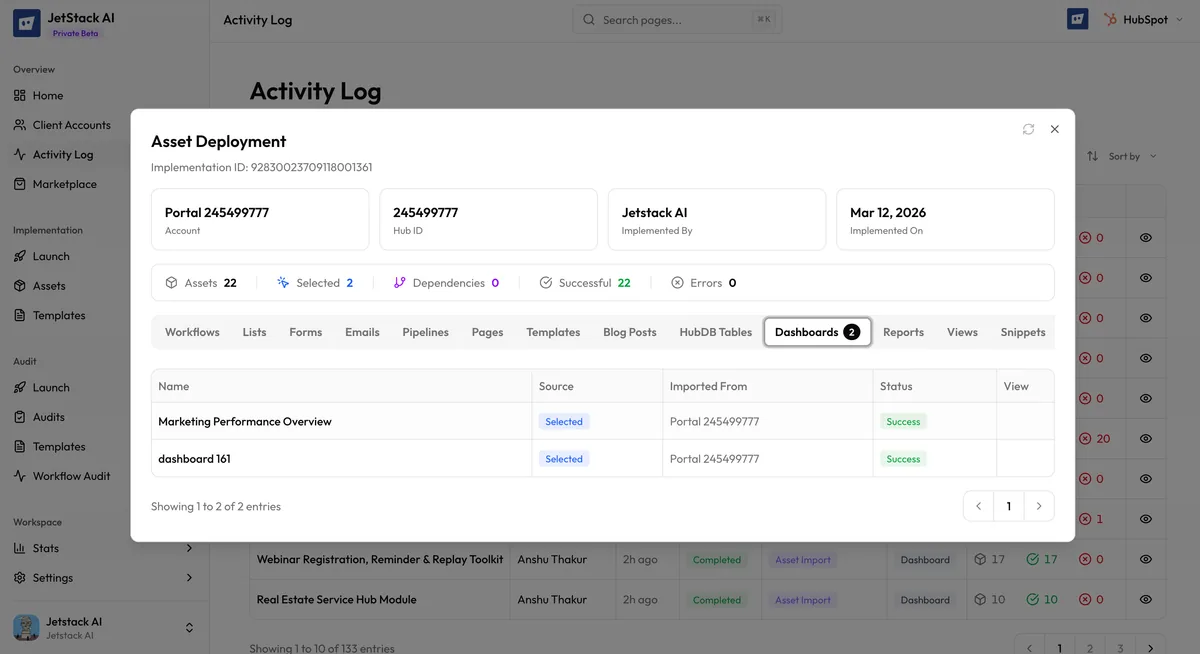
The task detail page is organized into several sections:
Task Header
Section titled “Task Header”The top of the page displays summary information about the task:
- Task type — Import, Deploy, or Bulk Property Creation
- Status — Current status with the corresponding color indicator (see Task Statuses)
- Source portal — The portal assets were imported from (for import tasks)
- Target portal — The portal assets were deployed to (for deploy tasks)
- Started at — Timestamp when the task began
- Completed at — Timestamp when the task finished (blank for in-progress tasks)
- Duration — Total elapsed time from start to completion
Progress Breakdown
Section titled “Progress Breakdown”Below the header, a progress summary shows aggregate counts:
| Metric | Description |
|---|---|
| Total | Number of assets included in this task |
| Succeeded | Assets that were processed without errors |
| Failed | Assets that encountered errors during processing |
| Skipped | Assets that were skipped (e.g., duplicates detected, circular dependencies) |
| Pending | Assets not yet processed (only shown for in-progress tasks) |
A progress bar visually represents the ratio of succeeded, failed, and skipped assets.
Asset-by-Asset Status
Section titled “Asset-by-Asset Status”The core of the detail view is the asset table. Every asset included in the task is listed with its individual outcome:
| Column | Description |
|---|---|
| Asset Name | The name of the asset as it appears in HubSpot |
| Asset Type | The category (form, workflow, email, page, property, etc.) |
| Status | Individual asset status: Succeeded, Failed, or Skipped |
| Error | Error message if the asset failed (blank for succeeded assets) |
| Duration | Time taken to process this specific asset |
You can sort the asset table by any column. Sorting by Status is useful for quickly finding all failed assets.
Error Messages
Section titled “Error Messages”When an asset fails, the error column displays the specific error message returned by HubSpot’s API or generated by JetStack AI’s processing engine. Common error patterns include:
- “Property [name] does not exist” — A referenced property is missing in the target portal. You may need to deploy properties before deploying dependent assets.
- “Rate limit exceeded” — HubSpot’s API rate limit was hit. Retrying the task usually resolves this.
- “Object type not found” — A custom object referenced by the asset does not exist in the target portal.
- “Duplicate detected: [name]” — An asset with the same name already exists. The asset was skipped rather than duplicated.
- “Authentication failed” — The portal’s OAuth token expired during processing. Reconnect the portal and retry.
Error messages are shown verbatim from the API response when available. JetStack AI adds context where the raw API message would be unclear.
Actions Available from the Detail View
Section titled “Actions Available from the Detail View”The detail view provides several actions depending on the task’s current status:
For In-Progress Tasks
Section titled “For In-Progress Tasks”- Cancel — Stop processing remaining assets. Assets already processed are not rolled back. The task status changes to Failed with a cancellation note.
For Failed Tasks
Section titled “For Failed Tasks”- Retry — Resubmit the task for processing. See Retrying Failed Tasks for details on what retry does.
- Delete — Remove the task record from the Activity Log entirely.
For Completed Tasks
Section titled “For Completed Tasks”- Delete — Remove the task record from the Activity Log.
For Partial Tasks
Section titled “For Partial Tasks”- Retry — Resubmit only the failed assets for reprocessing. Already-succeeded assets are not touched.
- Delete — Remove the task record.
Auto-Refresh for In-Progress Tasks
Section titled “Auto-Refresh for In-Progress Tasks”When viewing the detail page of an in-progress task, the page automatically refreshes every few seconds. The progress breakdown, pending count, and asset statuses update in real time as assets are processed. You do not need to manually reload the page.
Once the task completes, auto-refresh stops and the final status is displayed.
Using Details for Troubleshooting
Section titled “Using Details for Troubleshooting”The detail view is your primary tool for diagnosing issues with imports and deployments. A recommended workflow:
- Open the detail view for the failed or partial task.
- Sort the asset table by Status to group all failures together.
- Read the error messages to identify the root cause.
- Address the underlying issue (reconnect portal, deploy dependencies first, fix configuration).
- Retry the task.
For common error patterns and their solutions, see Import Failures and Deploy Failures.