Running Audits via Extension
Audits run through the Chrome Extension capture premium data points that the web dashboard cannot access. This is the primary reason to run audits from the extension rather than the dashboard. This page explains why extension audits are more comprehensive, what premium data points are, and walks through the 4-step audit wizard.
Why Extension Audits Capture More Data
Section titled “Why Extension Audits Capture More Data”The web dashboard communicates with HubSpot through OAuth-based public APIs. These APIs cover a broad range of data, but HubSpot reserves certain internal endpoints for its own application — they are not exposed through the public API surface.
The Chrome Extension’s service worker runs inside your browser, where it has access to HubSpot’s CSRF session cookies. This means it can call the same internal APIs that HubSpot’s own frontend uses. When an audit runs through the extension, it captures data from both the public APIs (same as the dashboard) and these internal APIs (extension-exclusive).
The result: extension audits evaluate more data points and produce more thorough findings.
What Are Premium Data Points
Section titled “What Are Premium Data Points”Premium data points are audit checks that rely on data only available through HubSpot’s internal APIs. These include information about:
- Portal usage metrics — Internal analytics about feature adoption, active user counts, and login patterns that HubSpot tracks but does not expose publicly
- Advanced workflow internals — Execution logs, internal performance metrics, and configuration details beyond what the public workflow API returns
- Email deliverability internals — Sending reputation data, bounce classifications, and throttling states from HubSpot’s internal email infrastructure
- CRM configuration details — Hidden settings, internal flags, and system-level configurations that affect portal behavior but are not surfaced through public endpoints
- Reporting engine data — Internal report computation details, data source configurations, and caching states
- Permission and access internals — Granular permission evaluations and access control configurations beyond what the public settings API exposes
When you view audit results (in either the extension or the dashboard), premium data points are marked so you can distinguish them from standard findings. Audits run from the dashboard still produce valuable results — they just lack these premium-tier checks.
The 4-Step Audit Wizard
Section titled “The 4-Step Audit Wizard”Step 1 — Select Template
Section titled “Step 1 — Select Template”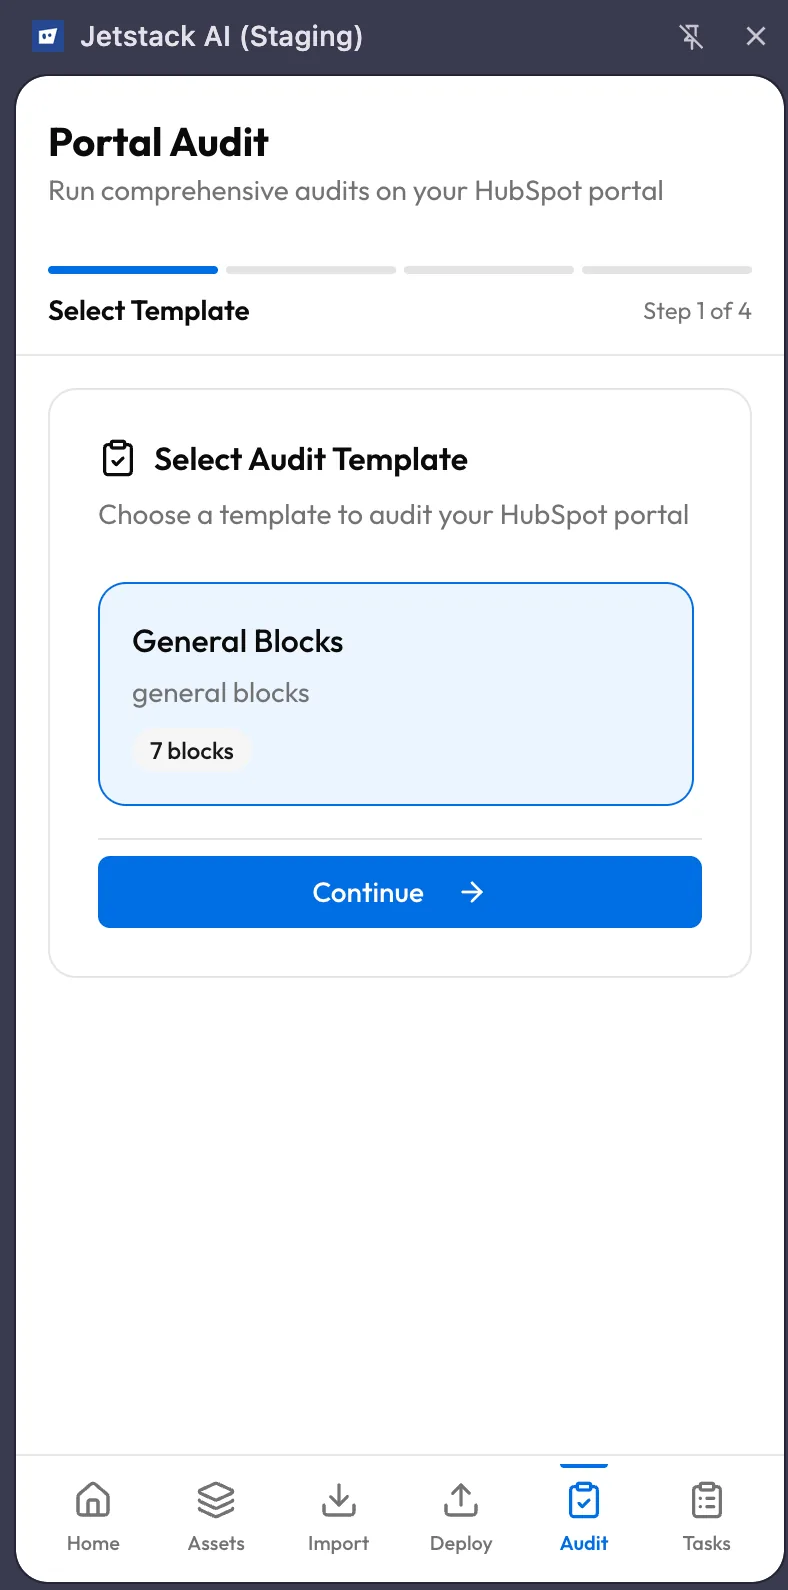
The first screen presents available audit templates. Each template defines a scope — which areas of the portal to evaluate and which data points to check.
- Browse the list of templates.
- Each template shows a name, description, and the number of data points it covers.
- Select the template that matches what you want to audit.
- Tap Next to proceed.
If you are unsure which template to use, choose the comprehensive template that covers the broadest scope. You can always run a narrower audit later.
Step 2 — Review and Confirm
Section titled “Step 2 — Review and Confirm”The review screen shows:
- Template name and description
- Data point count — Total number of checks, broken down into standard and premium
- Target portal — The HubSpot portal currently active in your browser tab
- Estimated duration — An approximate time for the audit to complete (varies by portal size and template scope)
Review the summary. If everything looks correct, tap Start Audit to begin data capture.
Step 3 — Data Capture
Section titled “Step 3 — Data Capture”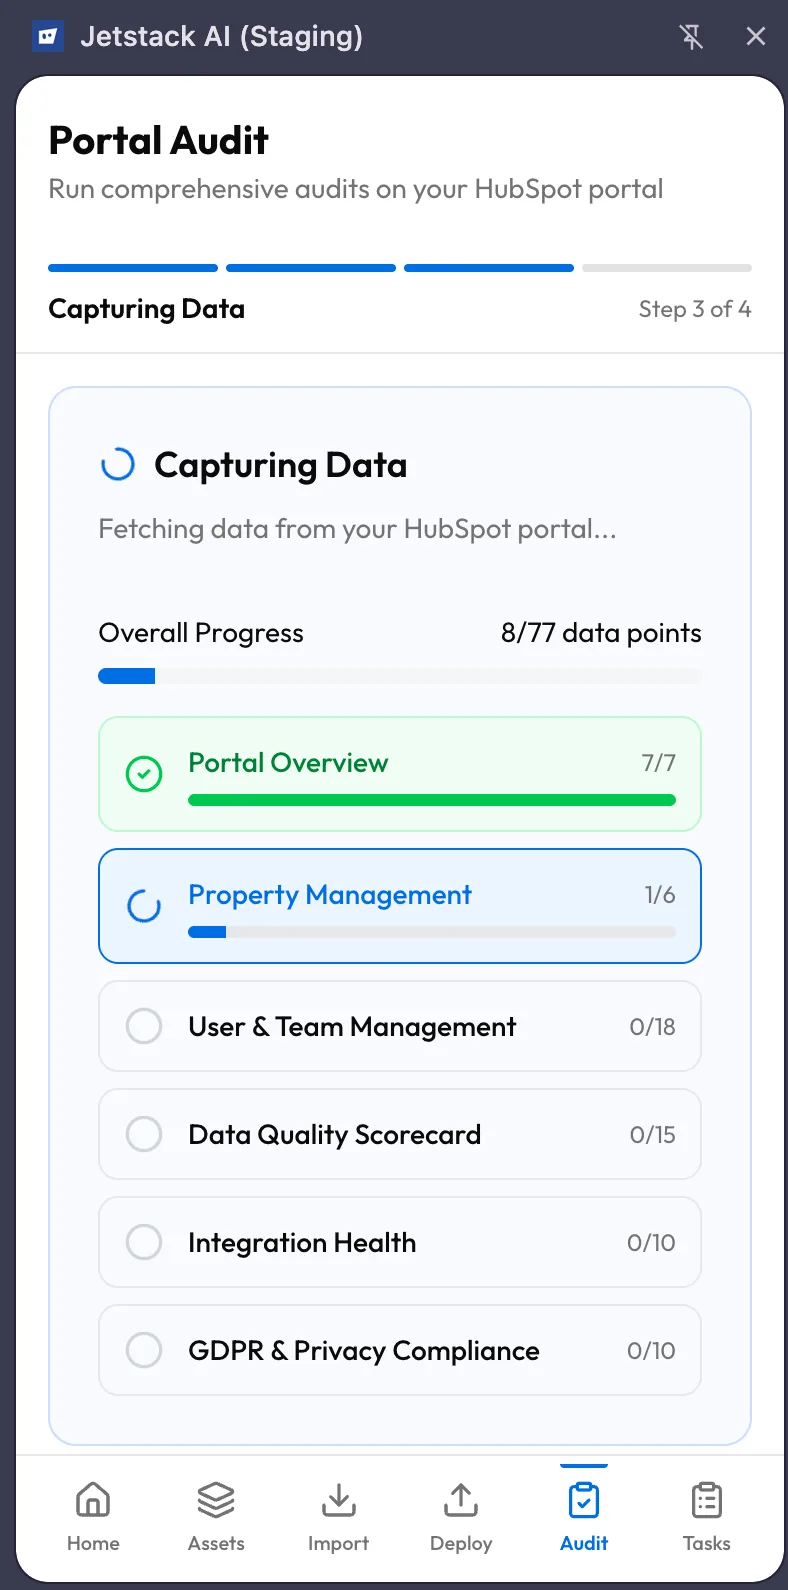
This is the step where the extension does its work. The audit executes block by block, and the screen shows real-time progress.
Block-by-Block Progress
Section titled “Block-by-Block Progress”Audits are divided into blocks — logical groups of related data points (e.g., “Workflow Configuration,” “Email Deliverability,” “Pipeline Structure”). The progress screen shows:
- A master progress bar tracking overall completion across all blocks
- A block list where each block shows its name, status (pending, capturing, completed), and the number of data points within it
- The currently active block is highlighted and updates in real time as individual data points are captured
What Happens During Capture
Section titled “What Happens During Capture”For each block, the extension’s service worker:
- Identifies the HubSpot API endpoints needed (both public and internal)
- Makes the API calls using the browser’s session cookies
- Collects the response data
- Sends it to the JetStack AI backend for analysis
This process runs automatically. You do not need to interact with the screen during capture, but you should keep the HubSpot tab open and stay logged in. If you close the tab or your HubSpot session expires mid-audit, the capture will fail for any remaining blocks.
Duration
Section titled “Duration”Audit duration depends on the portal size and template scope. A full audit on a large portal can take several minutes. Smaller portals or narrower templates complete faster. The progress bar gives you a reliable estimate of time remaining.
Step 4 — Results
Section titled “Step 4 — Results”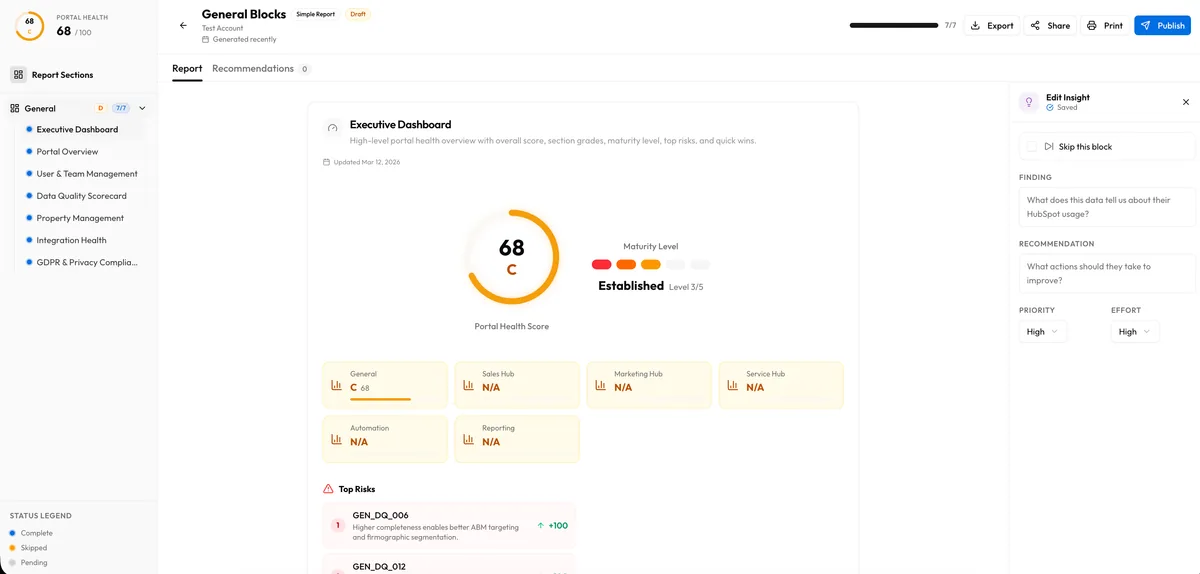
When capture completes, the extension shows a results summary:
- Total data points evaluated — broken into standard and premium counts
- Findings by severity — critical, warning, and informational counts
- Top findings — the most impactful issues discovered, with brief descriptions
For a detailed review of every finding, including AI-generated insights and recommendations, tap Open in Dashboard. The full audit results experience in the web dashboard provides more screen space for reading insights, comparing findings, and exporting reports.
Running Audits from the Dashboard vs. Extension
Section titled “Running Audits from the Dashboard vs. Extension”| Extension Audit | Dashboard Audit | |
|---|---|---|
| Standard data points | Yes | Yes |
| Premium data points | Yes | No |
| Requires HubSpot session | Yes | No |
| Results viewable in | Extension summary + full dashboard | Full dashboard |
| Best for | Maximum audit depth | Quick audits when not in HubSpot |
If you want the most thorough audit possible, always run it from the extension. If you need a quick check and are not currently in HubSpot, the dashboard audit still covers the standard data points.
What’s Next
Section titled “What’s Next”- Managing Tasks — Track audit progress alongside imports and deploys
- Extension Troubleshooting — Resolve common audit issues like session expiration and capture failures