Managing Tasks
Every action you take in the JetStack AI Chrome Extension — importing assets, deploying to a portal, running an audit — creates a task. The Tasks tab gives you a centralized view of all tasks in your workspace, with real-time status updates, filtering, and the ability to jump to detailed views in the web dashboard. This page covers the task list, filters, detail view, and real-time behavior.
Opening the Tasks Tab
Section titled “Opening the Tasks Tab”Tap Tasks in the bottom navigation bar. The task list loads immediately, showing all tasks in your current workspace ordered by most recent first.
Task List
Section titled “Task List”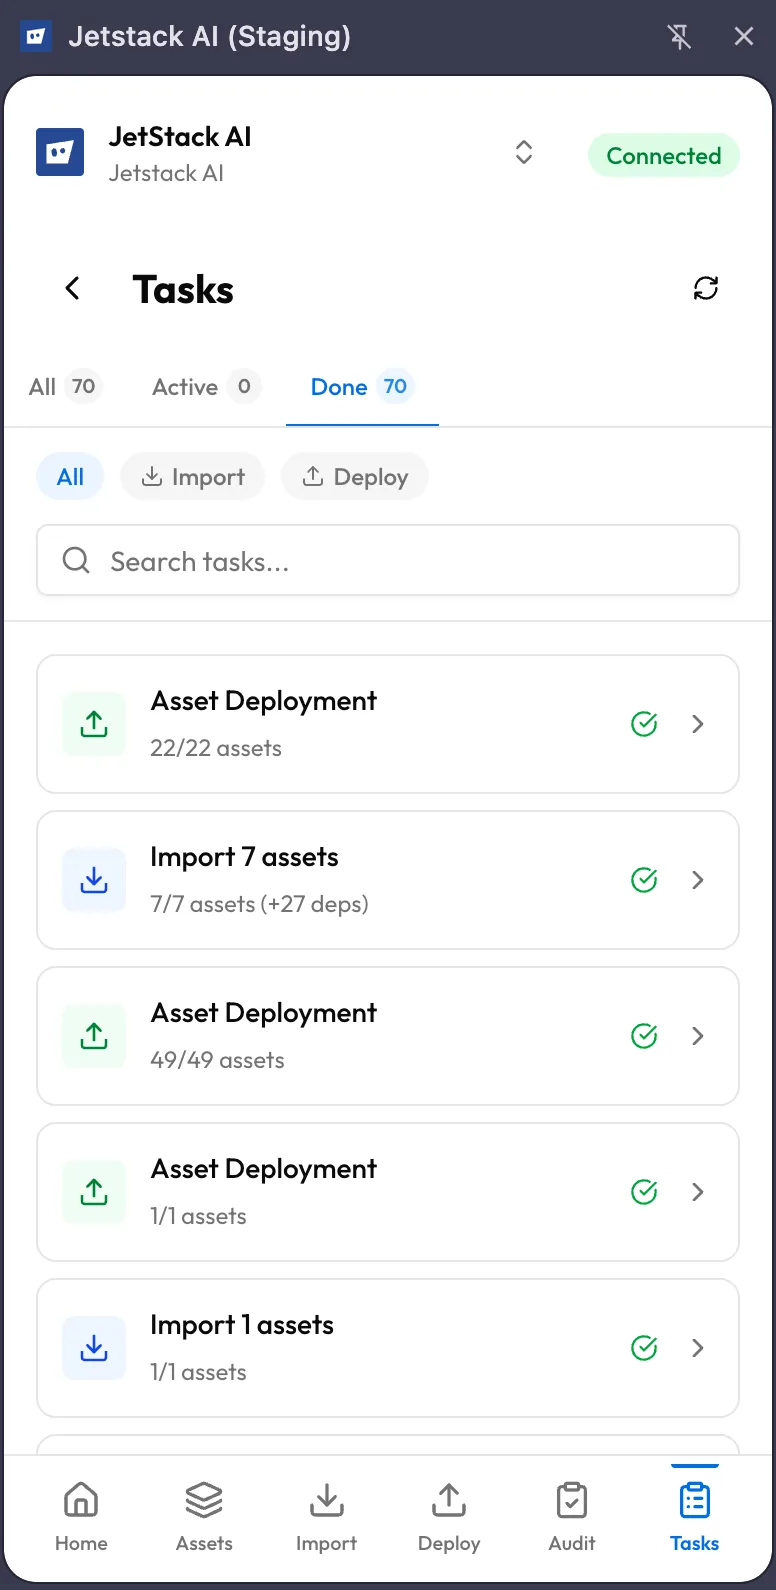
Each task in the list displays:
- Task name — A descriptive label such as “Import 5 Dashboards from Portal X” or “Audit Portal Y — Full Template”
- Type icon — A visual indicator showing whether the task is an import, deploy, or audit
- Status badge — The current state of the task:
| Status | Meaning |
|---|---|
| Running | The task is actively in progress |
| Completed | The task finished successfully |
| Failed | The task encountered an error and stopped |
| Partial | Some assets in the task succeeded while others failed |
- Timestamp — When the task was created or last updated
- Asset count — The number of assets involved (e.g., “8 assets” for an import, “12 assets” for a deploy)
Filtering Tasks
Section titled “Filtering Tasks”The top of the Tasks tab provides two filter dimensions:
Status Filter
Section titled “Status Filter”Filter the task list by status to focus on what matters:
- All — Show every task
- Running — Show only tasks currently in progress
- Completed — Show only finished tasks
- Failed — Show only tasks that encountered errors
Type Filter
Section titled “Type Filter”Filter by task type:
- All — Show imports, deploys, and audits
- Import — Show only import tasks
- Deploy — Show only deployment tasks
- Audit — Show only audit tasks
Filters combine. Selecting “Running” and “Deploy” shows only deployment tasks that are currently in progress. The task count updates to reflect the active filters.
Task Detail View
Section titled “Task Detail View”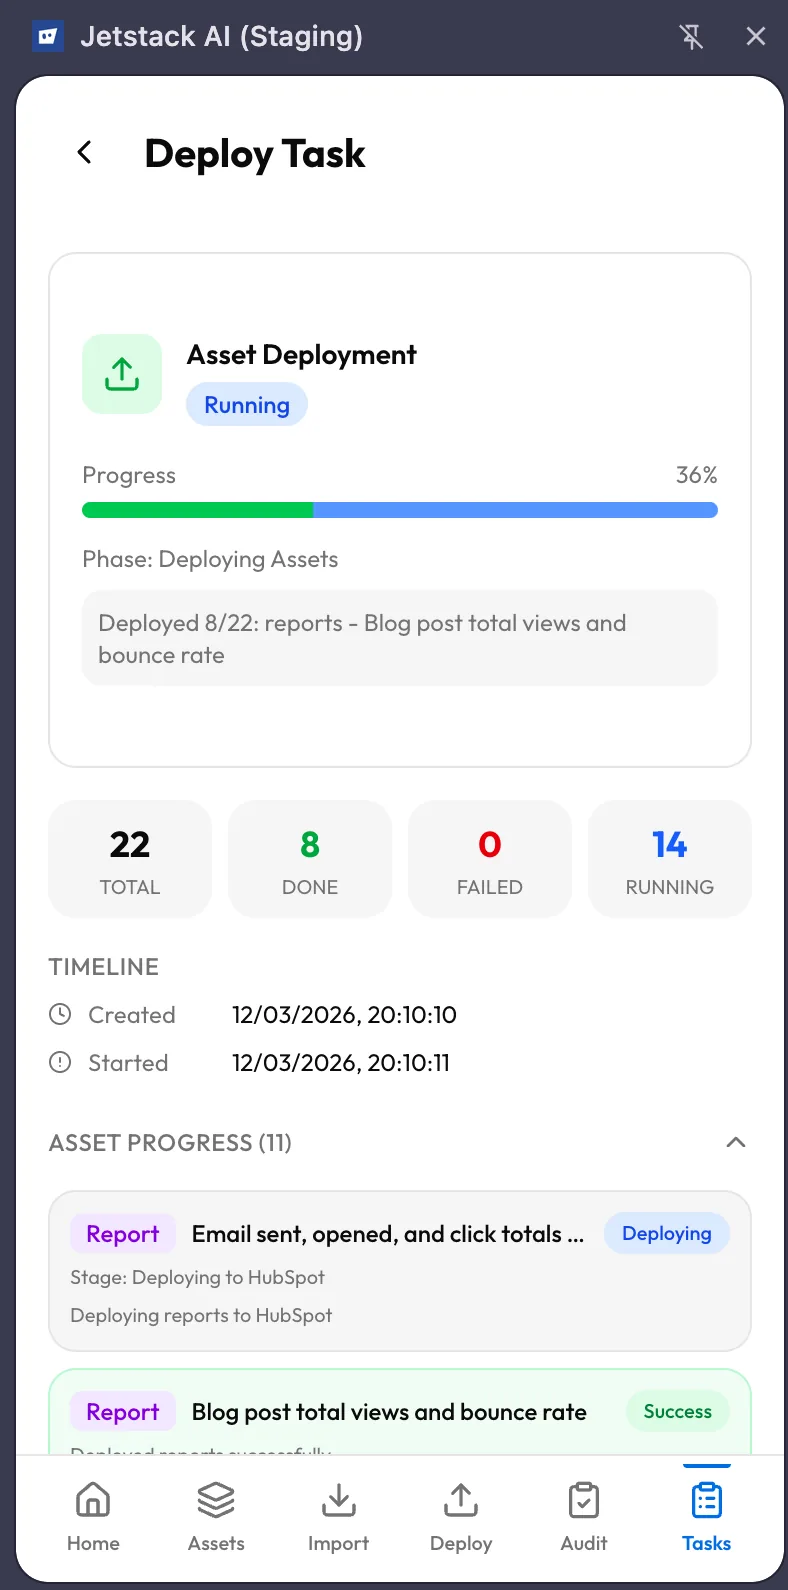
Tap any task in the list to open its detail view. The detail screen provides a deeper look at the task’s execution.
Progress Bar
Section titled “Progress Bar”A progress bar at the top shows overall completion as a percentage. For running tasks, this bar updates in real time as individual assets are processed.
Asset-Level Status
Section titled “Asset-Level Status”Below the progress bar, a list shows every asset involved in the task with its individual status:
- Pending — Not yet started
- Processing — Currently being imported, deployed, or audited
- Completed — Finished successfully
- Failed — Encountered an error (with error message)
Each asset entry includes:
- Asset name and type
- Start time and completion time (if finished)
- Error details (if failed)
Timestamps
Section titled “Timestamps”The detail view shows key timing information:
- Created — When the task was initiated
- Started — When processing began
- Completed — When the last asset finished (or when the task was marked failed)
- Duration — Total elapsed time
Real-Time Updates
Section titled “Real-Time Updates”Task progress updates are delivered in real time via Firebase Firestore listeners. You do not need to refresh the page or pull to reload.
When a task is running:
- The progress bar advances as each asset completes
- Individual asset statuses flip from “Pending” to “Processing” to “Completed” (or “Failed”)
- The status badge on the task list updates immediately when a task finishes
This real-time behavior works across both the task list and the detail view. If you are watching the list and a running task completes, its status badge changes to “Completed” without any interaction from you.
Real-time updates also sync across interfaces. If you start a deploy from the extension and then open the web dashboard, the same task appears there with the same live progress.
Open in Dashboard
Section titled “Open in Dashboard”Every task detail view includes an Open in Dashboard button. Tapping it opens the corresponding task in the JetStack AI web dashboard in a new browser tab.
Use this when you need:
- More screen space to review results, especially for audits with many findings
- Export capabilities that are only available in the dashboard
- AI-generated insights for audit findings, which are rendered more fully in the dashboard’s wider layout
- Historical comparison to see how this task relates to previous runs
The dashboard task view shows the same data as the extension detail view, plus additional context that benefits from a full-screen layout.
Task Lifecycle
Section titled “Task Lifecycle”Tasks follow a predictable lifecycle:
- Created — The task is queued when you confirm an import, deploy, or audit
- Running — The backend (or extension service worker, for extension-initiated tasks) begins processing
- Completed / Failed / Partial — The task reaches a terminal state
Once a task reaches a terminal state, it stays in your task list indefinitely for reference. There is no automatic cleanup. If your task list grows long, use the filters to focus on recent or active tasks.
What’s Next
Section titled “What’s Next”- Extension Overview — Return to the sidebar layout and navigation reference
- Extension Troubleshooting — Resolve common task-related issues