Extension Overview
The JetStack AI Chrome Extension is a sidebar panel that opens directly on HubSpot pages. It gives you access to imports, deployments, audits, and task management without switching away from the portal you are working in. This page covers the sidebar layout, the home screen, navigation, and guidance on when to use the extension versus the web dashboard.
Sidebar Layout
Section titled “Sidebar Layout”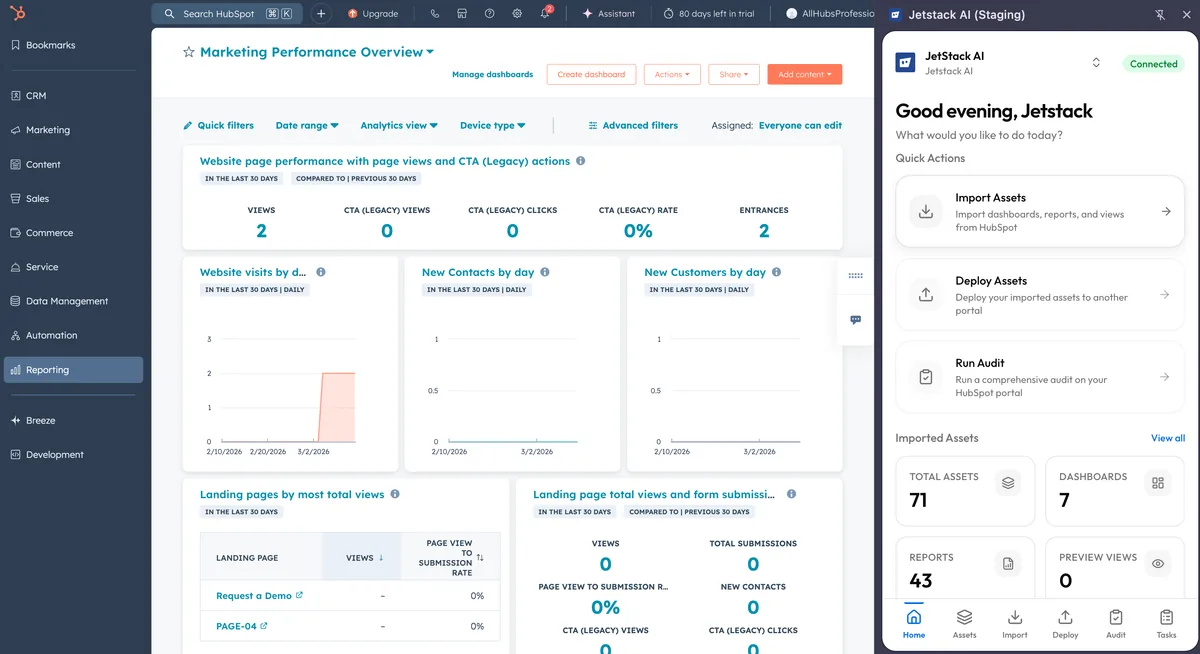
The extension renders as a 640px-wide side panel anchored to the right side of your browser window. It sits alongside HubSpot content, so you can reference portal data while interacting with JetStack AI.
The layout has three zones:
- Header — Displays the JetStack AI logo, your current workspace name, and the workspace selector dropdown. If your account belongs to multiple organizations, switch between them here.
- Content area — The main body of whichever screen you are on (Home, Assets, Import, Deploy, Audit, or Tasks).
- Bottom navigation bar — A persistent tab bar with six destinations: Home, Assets, Import, Deploy, Audit, and Tasks.
Home Screen
Section titled “Home Screen”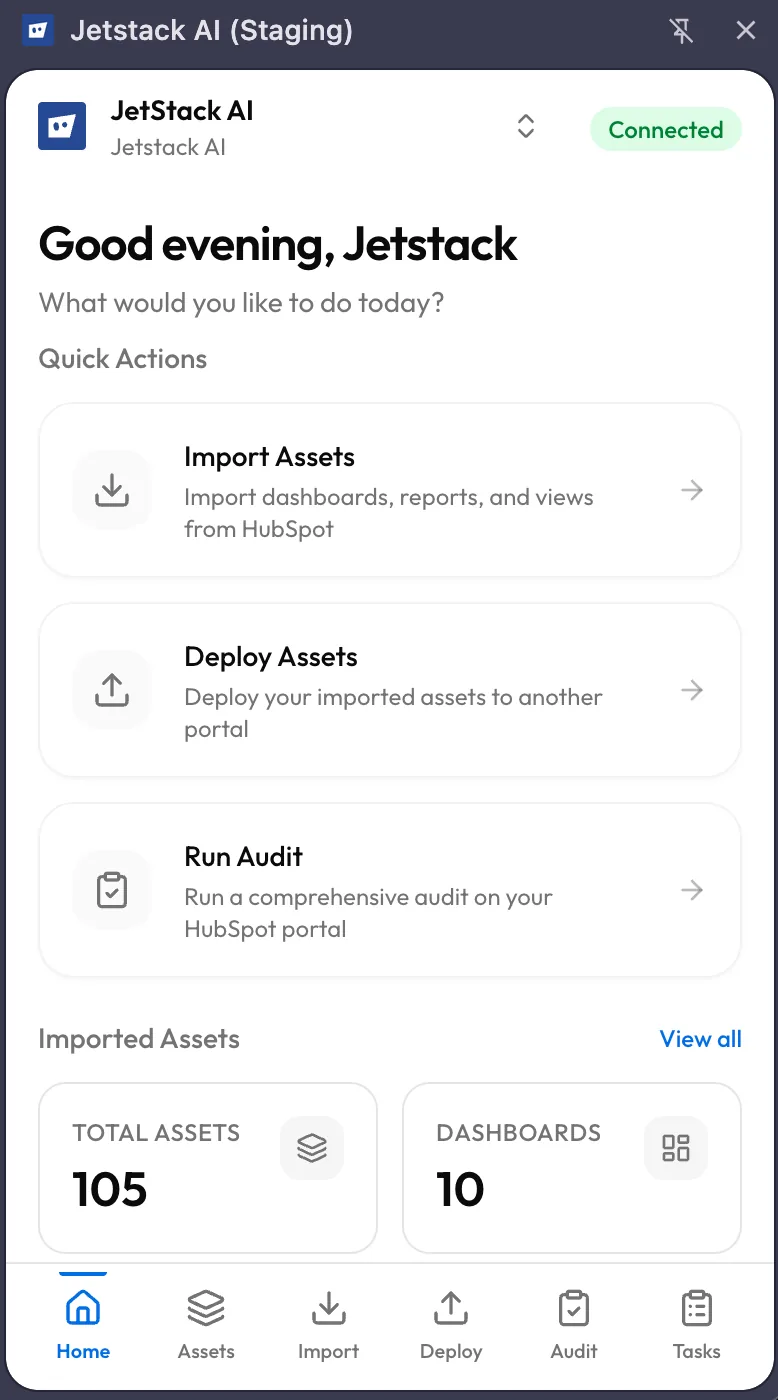
When you open the extension, the Home screen is the first thing you see. It provides an at-a-glance summary of your workspace activity.
Time-Aware Greeting
Section titled “Time-Aware Greeting”The top of the screen shows a greeting that adjusts based on the time of day — “Good morning,” “Good afternoon,” or “Good evening” — followed by your name.
Quick Action Cards
Section titled “Quick Action Cards”Below the greeting, three action cards provide one-tap access to the most common workflows:
| Card | Action |
|---|---|
| Import | Jump directly to the Import screen to pull assets from the current HubSpot portal |
| Deploy | Open the Deploy wizard to push assets to a destination portal |
| Audit | Start a new audit on the connected portal |
Asset Statistics
Section titled “Asset Statistics”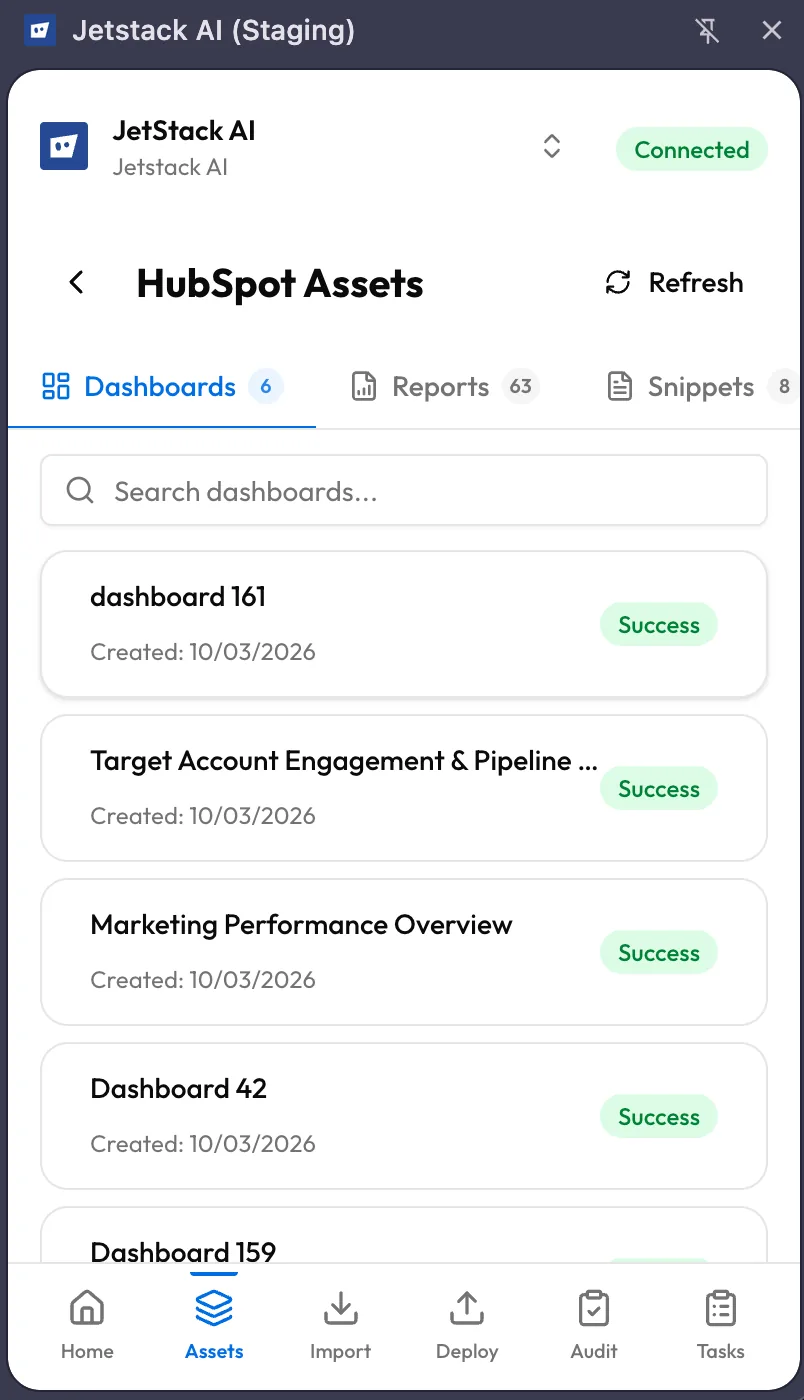
A statistics section shows counts of imported assets in your workspace, broken down by type. This gives you a quick sense of how much content has been captured and is available for deployment.
Recent Tasks
Section titled “Recent Tasks”The bottom of the Home screen lists your most recent tasks — imports, deploys, and audits — with their current status (running, completed, failed). Tap any task to jump to its detail view.
Bottom Navigation
Section titled “Bottom Navigation”
The bottom nav bar is always visible and contains six tabs:
| Tab | Purpose |
|---|---|
| Home | Dashboard with greeting, quick actions, statistics, and recent tasks |
| Assets | Browse all imported assets by type, search, and view details |
| Import | Import new assets from the active HubSpot portal |
| Deploy | Deploy assets to a destination portal with mapping and conflict resolution |
| Audit | Run audits that capture premium data points via internal HubSpot APIs |
| Tasks | View and manage all running and completed tasks |
The active tab is highlighted so you always know where you are.
Extension vs. Web Dashboard
Section titled “Extension vs. Web Dashboard”The extension and the web dashboard connect to the same backend and share the same data. The difference is context and capability.
Use the Extension When
Section titled “Use the Extension When”- You are already inside HubSpot and want to import, deploy, or audit without switching tabs
- You need to run an audit with premium data points — the extension captures data from internal HubSpot APIs that the browser session has access to, which the web dashboard cannot reach
- You want to import extension-exclusive asset types — Dashboards, Reports, Snippets, Goal Templates, Lead Scores, CRM Cards, Preview Views, Playbooks, and Permission Sets are only available through the extension because they require HubSpot session cookies
- You want quick status checks — glance at recent tasks or asset counts without loading a full dashboard
Use the Web Dashboard When
Section titled “Use the Web Dashboard When”- You need full-screen workspace for reviewing audit results, reading AI-generated insights, or comparing assets side by side
- You are managing portals and team members — portal connection, user invitations, and billing are dashboard-only operations
- You want to use the Marketplace — template and module browsing lives in the web dashboard
- You are working with implementation-heavy asset types — workflows, lists, forms, emails, pages, and other core assets are managed through the dashboard implementation flow
- You need detailed reporting — audit history, trend analysis, and export features are richer in the dashboard
Shared Capabilities
Section titled “Shared Capabilities”Both interfaces share the same JetStack AI backend. An asset imported via the extension appears immediately in the dashboard, and a task started from the dashboard shows up in the extension’s Tasks tab. There is no sync delay — both read from the same Firestore database in real time.
Architecture at a Glance
Section titled “Architecture at a Glance”Understanding the extension’s architecture is not required for daily use, but it helps explain why certain features (like premium audit data) are extension-exclusive.
- The extension’s service worker runs in the background and proxies API calls to HubSpot using the browser’s active session cookies (CSRF tokens). This is how it reaches internal HubSpot endpoints that require an authenticated browser session.
- The React UI runs inside the sidebar panel iframe and communicates with the service worker via Chrome’s messaging API.
- Real-time updates come from Firebase Firestore listeners. When a task progresses on the server, the sidebar updates automatically — no polling, no manual refresh.
- Hublet routing is handled automatically. If HubSpot returns a 488 status code (indicating a hublet mismatch), the service worker corrects the base URL and retries the request transparently.
What’s Next
Section titled “What’s Next”- Installing the Extension — Install and authenticate if you have not already
- Importing Assets via Extension — Import the 9 extension-exclusive asset types
- Running Audits via Extension — Capture premium audit data that the dashboard cannot access