Understanding the Dashboard
The JetStack AI dashboard is your central workspace for managing portals, running implementations and audits, and tracking activity across all your client accounts. This page walks through every section so you know where to find what you need.
Dashboard Layout
Section titled “Dashboard Layout”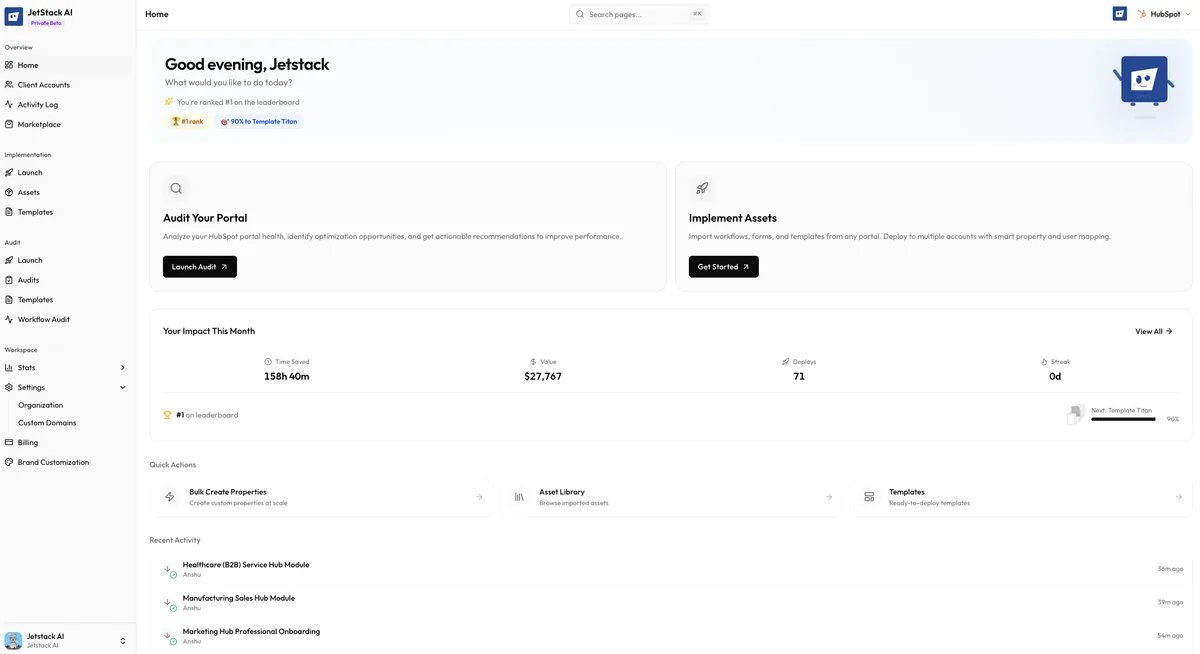
When you sign in, you land on the Home screen. The layout is split into two areas:
- Sidebar navigation on the left — persistent across all pages, giving you access to every section of JetStack AI.
- Main content area on the right — displays the active page content, starting with the Home dashboard.
Home Dashboard
Section titled “Home Dashboard”The Home screen is designed to surface what matters most and get you moving quickly.
Jetty Greeting
Section titled “Jetty Greeting”At the top of the Home screen, Jetty — the JetStack AI mascot — greets you with a personalized welcome message. This is not just decorative. The greeting area highlights your current status and may surface suggestions based on your recent activity, such as reminding you to review a completed audit or continue an in-progress deployment.
Quick Action Cards
Section titled “Quick Action Cards”Below the greeting, you will find quick action cards — large, clickable tiles for the three primary workflows:
- Import — Jump straight to the implementation flow to import assets from a source portal.
- Deploy — Go to asset deployment if you have previously imported assets ready to push to a destination portal.
- Audit — Launch an audit on any connected portal.
These cards are the fastest way to start your most common tasks without navigating through the sidebar.
Stats Widget
Section titled “Stats Widget”The stats widget provides an at-a-glance summary of your workspace activity:
| Stat | What It Shows |
|---|---|
| Assets | Total number of assets imported across all portals |
| Audits | Total number of audits completed |
| Deploys | Total number of successful deployments |
| Portals | Number of currently connected portals |
These numbers update in real time as you complete actions.
Recent Activity Feed
Section titled “Recent Activity Feed”Below the stats, the recent activity feed shows a chronological list of the latest actions in your workspace — imports started, audits completed, deployments finished, portals connected. Each entry includes a timestamp and status indicator. Click any activity entry to jump to its detail page.
Sidebar Navigation
Section titled “Sidebar Navigation”The sidebar is organized into four main sections, each containing related pages.
Overview
Section titled “Overview”The Overview section covers your workspace-level views:
- Home — The main dashboard described above. Your starting point every time you sign in.
- Client Accounts — View and manage all connected HubSpot portals. Add new portals, check connection status, disconnect portals, and see portal details including Hub ID and plan tier.
- Activity Log — A full, searchable log of every action taken in your workspace. Filter by action type, portal, date range, or user. This is where you go to track the real-time progress of running tasks — imports, deployments, and audits all report their step-by-step progress here.
- Marketplace — Browse pre-built templates and modules available for deployment. The Marketplace is organized by category and use case, making it easy to find proven starting points for common implementation patterns.
Implementation
Section titled “Implementation”The Implementation section is where you manage the full asset lifecycle:
- Launch — Start a new implementation by selecting a source portal and choosing which asset types to import.
- Assets — View all imported assets across your workspace. Filter by type, portal, or status. Select assets for deployment to a destination portal.
- Templates — Access and manage implementation templates — saved configurations that let you replicate a proven implementation setup across multiple client portals without re-selecting assets each time.
The Audit section handles portal analysis:
- Launch — Start a new audit by selecting a connected portal.
- Audits — View all completed and in-progress audits. Click into any audit to see the full findings report with severity levels, category breakdowns, and AI-generated recommendations.
- Templates — Manage audit templates to customize which data points are evaluated. Useful when you want to focus audits on specific areas like workflow efficiency or property hygiene.
- Workflow Audit — A specialized audit focused exclusively on workflow analysis. This deep-dive evaluates workflow logic, enrollment triggers, branching, delays, and performance patterns across all workflows in a portal.
Workspace
Section titled “Workspace”The Workspace section covers account and organization settings:
- Stats — Detailed usage statistics for your organization, including historical trends for imports, deployments, and audits over time.
- Settings — Organization-level settings including team member management, notification preferences, and default configurations.
- Billing — View your current plan, manage payment methods, review invoices, and upgrade or modify your subscription.
- Brand — Configure your organization’s branding for white-label reports and client-facing outputs. Upload your logo, set brand colors, and customize the appearance of audit reports you share with clients.
Key Pages to Know
Section titled “Key Pages to Know”If you are just getting started, these are the pages you will use most:
- Client Accounts — Connect your portals here first. Everything else depends on having at least one connected portal.
- Implementation > Launch — Where every import begins. Select a source portal, pick your asset types, and start importing.
- Audit > Launch — Where every audit begins. Select a portal and kick off the scan.
- Activity Log — Your real-time progress tracker. When an import, deployment, or audit is running, this is where you monitor it.
- Assets — After importing, this is where you review what was pulled in and select assets for deployment.
Next Steps
Section titled “Next Steps”- Connecting Your First Portal — If you have not connected a portal yet, start here
- Plans and Limits — Understand what features are available on your plan
- Running an Audit — Launch your first portal audit
- Importing Assets — Start your first implementation