Launching and Monitoring
The fourth and final step of the audit wizard is the confirmation screen. Here you review all your selections, adjust the audit name if needed, and launch the audit. Once launched, you can monitor progress in real time.
The Confirmation Screen
Section titled “The Confirmation Screen”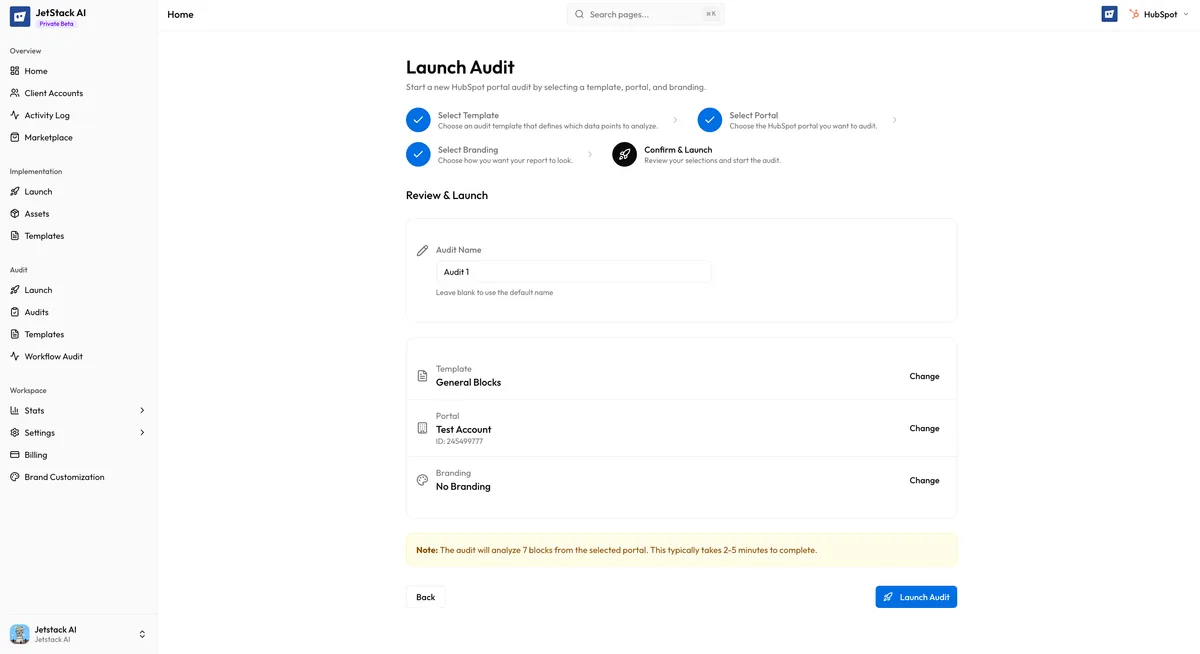
The confirmation screen presents a summary of everything you have configured across the previous three steps:
- Template — The selected audit template name, along with the mode (Quick or Full) and the number of blocks included
- Portal — The target portal name, portal ID, and HubSpot tier
- Branding — The selected brand configuration name, or “Default (JetStack AI)” if no custom branding was chosen
- Audit name — An auto-generated name in the format:
{Template Name} - {Portal Name} ({Date})
Review each item carefully. If anything is incorrect, use the Back button to return to the relevant step and make changes.
Editing the Audit Name
Section titled “Editing the Audit Name”The auto-generated audit name follows the pattern:
Full Portal Audit - Acme Corp (Mar 12, 2026)This name is editable. Click on the name field to modify it. The name is used to identify the audit in your audit list, activity log, and as the report title. Choose something descriptive that will help you and your team locate this audit later.
Good naming practices:
- Include the client or portal name for easy identification
- Add context if you run multiple audits on the same portal (e.g., “Acme Corp - Q1 Review” vs “Acme Corp - Post-Migration Check”)
- Keep names concise but specific
Launching the Audit
Section titled “Launching the Audit”Click the Launch button to start the audit. Once launched:
- The audit is created with a CREATED status and queued for processing
- The wizard closes and you are redirected to the audit detail page
- Processing begins automatically within seconds
The Launch button is disabled while the audit is being created to prevent duplicate submissions. If the creation fails (e.g., due to a network error), an error message is displayed and you can retry.
Monitoring Progress
Section titled “Monitoring Progress”After launch, the audit detail page shows real-time progress information. The display varies depending on the current state:
Processing View
Section titled “Processing View”While the audit is running, you see:
- Progress bar — A visual indicator showing overall completion percentage
- Current block — The name of the analysis block currently being processed (e.g., “Analyzing Email Marketing…” or “Scoring Deal Pipeline…”)
- Elapsed time — How long the audit has been running
- Estimated time — An estimate of remaining time based on the template mode (Quick: 2-5 minutes, Full: 5-15 minutes)
The page auto-polls every 5 seconds to fetch the latest progress. You do not need to manually refresh. You can navigate away from the page and return later — the audit continues processing in the background.
Completion View
Section titled “Completion View”When the audit finishes successfully:
- The progress bar shows 100% completion
- A “View Report” button appears, linking directly to the generated report
- The audit status changes to COMPLETED
- A summary of the results is shown: overall portal health score, section-level scores, and the number of recommendations generated
Failure View
Section titled “Failure View”If the audit encounters a fatal error:
- The progress bar stops and the status changes to FAILED
- Error details are displayed explaining what went wrong
- Troubleshooting links point to relevant documentation for the specific error type
- A Retry button allows you to relaunch the same audit configuration without going through the wizard again
Common failure causes include expired OAuth tokens, HubSpot API rate limits, and insufficient portal permissions. See Troubleshooting Audit Failures for detailed resolution steps.
What Happens During Processing
Section titled “What Happens During Processing”Behind the scenes, the audit engine performs the following steps in order:
- Data retrieval — Connects to the HubSpot API and fetches data for each block defined in the template. API calls are batched and rate-limited to stay within HubSpot’s API limits.
- Extension data (if applicable) — If the template includes extension-dependent data points and extension data has been provided, it is merged into the dataset.
- Scoring — Each data point is evaluated against benchmarks. Scores roll up from data points to blocks, blocks to sections, and sections to the overall portal score.
- AI analysis — Scored data is sent to Claude Haiku, which generates findings, recommendations, priority ratings, and effort estimates for each block.
- Executive summary — A final AI pass generates the overall executive summary.
- Report generation — The branded report is assembled and made available at a shareable URL.
After the Audit Completes
Section titled “After the Audit Completes”Once you have a completed audit, you can:
- View the report — See the full analysis, scores, and recommendations
- Share the report — Send a link to clients or stakeholders
- Review AI insights — Dive into block-level findings
- Run another audit — Use the same or different template on the same or different portal
Completed audits are stored in your audit history and can be accessed at any time from the Audits list in the sidebar.
Next Steps
Section titled “Next Steps”- Progress States — Detailed reference for every audit status
- Troubleshooting Audit Failures — Resolve common audit errors
- Viewing Reports — Navigate and interpret the finished report